Using WMS Inventory Reporting to Improve Space, Stock & 3PL Reporting
CartonCloud industry experts share their top warehouse space optimization strategies you can implement today — plus the real-time warehouse reporting tools and WMS inventory reporting features that help 3PLs make every square foot of space more profitable.
Author:
Javier Hernandez
.webp)
TABLE OF CONTENTS
Your warehouse space is prime real estate, but without the right WMS inventory reporting, it’s way too easy for that valuable space to get eaten up by slow-moving stock or awkward location placements.
Time for a warehouse glow-up!✨
(No need for new racking or knocking down walls — just better visibility. With real-time warehouse reporting tools and clear warehouse inventory reports, you can transform your 3PL stock layout using data you already have.)
With CartonCloud’s real-time WMS inventory reporting, you can track SKU movement, monitor location performance, and spot congestion before it slows your order fulfillment down — helping you scale faster without needing to expand your warehouse footprint.
TL;DR: CartonCloud industry experts share their top warehouse space optimization strategies you can implement today — plus the real-time warehouse reporting tools and WMS inventory reporting features that help 3PLs make every square foot of space more profitable.
Q: How can I maximize space in my 3PL warehouse?
A: The fastest and most effective way to maximize space in your 3PL warehouse is to use real data from your WMS to guide how products are stored, moved, and replenished. You can use real stock movement trends, SKU velocity insights, location usage, and e-commerce warehouse analytics within CartonCloud’s WMS to make every area of your warehouse more efficient.
Here are a couple top tips for 3PL warehouse space optimization:
- Identify slow moving stock: Move long-sitting SKUs to the back of your warehouse in order to free up prime pick faces for those items that get shipped most often. (Check out our Bulk Charges report to see how long your stock has stayed in a particular area to help determine what stock needs to be rearranged in your warehouse).
- Optimize slotting based on demand: Use SKU velocity data to place your most popular SKUs closest to the pack station to help reduce picking time. (Use our Stock Movement report to see which products are constantly being moved around to help guide stock placement decisions).
- Consolidate partially used pick faces: Clear out half-empty bays or split locations that waste valuable cubic space.
- Reassign underused zones: Convert your warehouse zones into new pick areas or into bulk storage.
For more tips on how to design your physical warehouse space, check out our free, step-by-step guide on setting up your physical warehouse space here.
.webp)
Q: Can WMS inventory reporting & data unlock new warehouse insights?
A: Yes! You can unlock new warehouse insights by using your WMS inventory reporting data to get a clear snapshot into how your warehouse is performing at any point in time.
There are several insights you can pull from CartonCloud’s real-time warehouse reporting tools. For example:
- Stock movement trends, such as which of your SKUs are most frequently picked.
- Location performance to identify high-traffic areas or underused racking.
- Storage behaviour to understand how long stock sits before dispatch, helping you price storage correctly and cycle out low-performing inventory.
Our experts will cover which CartonCloud reports you can use to get this data in detail below!
Q: Can WMS analytics reduce congestion in my warehouse?
A: Yes, when you analyze your order flow and location usage through your CartonCloud WMS, you can quickly identify where congestion is forming — and then redistribute stock, adjust pick paths, or reassign staff to keep your warehouse moving efficiently.
“Using the data in CartonCloud’s 3PL stock report, you can remap your warehouse locations by pick efficiency, so the next time you’re planning a wave pick, the system will route your pick path according to how you categorized your A, B, and C products.” — Javier Hernandez, Implementation Consultant, CartonCloud
In CartonCloud, you can configure the location efficiency of each warehouse location so the system automatically prioritizes stock in your most accessible spots. When a picker is assigned an order, CartonCloud will guide them to the closest location first, reducing unnecessary travel time and keeping fulfillment flowing smoothly.
“We always recommend reviewing location efficiency data regularly — especially after peak periods or major stock changes. Even small tweaks, like moving a top-seller closer to your packing area, can shave seconds off every pick, which can really add up.” — Javier Hernandez, Implementation Consultant, CartonCloud
A key best practice is to categorize your products into ‘A, B, and C movers’.
- A-movers (or your fastest-selling SKUs) should be placed in the most accessible pick faces to reduce travel time between picking and packing.
- B and C-movers can be positioned further back in your warehouse, freeing up prime space for the SKUs that drive the most activity.
Hint: You can find out this data within CartonCloud’s 3PL stock report!
Q: What reports are most useful for e-commerce fulfilment?
A: CartonCloud gives you access to real-time data and automatically generated reports for clear, e-commerce warehouse analytics into stock movement, storage behaviour, picking performance, and overall warehouse efficiency — helping you optimize your space and speed up fulfillment.
“The Stock Movement Report, Bulk Charges Report, and the BI Dashboard in CartonCloud are especially helpful real-time warehouse reporting tools that you can use for improving accuracy and streamlining your warehouse space optimization. They show you what’s really happening on the floor, so you can prioritize fast moving stock, prevent bottlenecks, and build smarter pick paths.” — Olivia Trankina, North American Operations Manager, CartonCloud
This report lets you deep-dive into how your stock is actually moving through the warehouse, using filters that give you a clearer picture of daily activity. In the Stock Movement report, you can filter by:
- Location to see which warehouse locations are picked from or replenished the most. This makes it easy to spot high-traffic areas and decide whether certain SKUs should be moved to more accessible pick faces.
- Product to identify your fast moving stock and place those SKUs closer to pack stations for a quicker turnaround.
This report helps you understand your 3PL storage behaviour, which is especially valuable for e-commerce operations where profit comes from in-and-out stock movement rather than providing long-term storage.
Within the Bulk Charges report, you can filter by storage period to quickly identify products that have been sitting on racks longer than expected. From there, you can decide whether to relocate them towards the back of your warehouse or increase your storage rate charges.
“In e-commerce, it’s essential to prioritize your fast movers because your revenue comes from stock moving in and out — not from long-term storage. The Bulk Charges report helps you see when storage rates may need adjusting or when certain products should be cycled out.” — Javier Hernandez, Implementation Consultant, CartonCloud
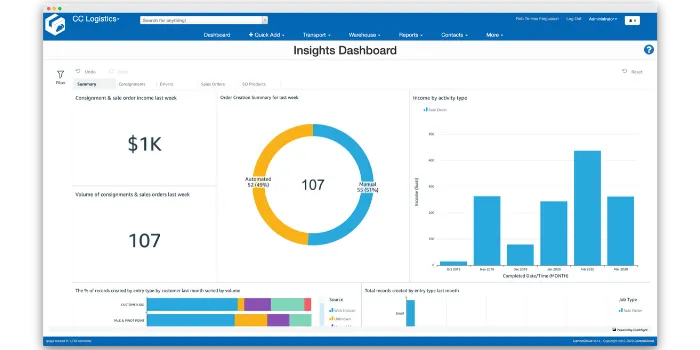
Within the CartonCloud BI Dashboard, you can see the average number of SKUs picked per hour by each picker. This metric gives you a clear view of individual and team efficiency — helping you to spot where performance can be improved through better slotting or location adjustments.
Q: Can I automate my 3PL inventory management, billing, & accounting into one system?
A: Yes, you can automate your entire 3PL operation by running your inventory, billing, and accounting all within CartonCloud’s WMS software.
CartonCloud captures all your data into one place — automatically capturing every stock movement and storage charge — and then instantly creates an invoice that syncs directly back into your accounting software like Xero, MYOB, or QuickBooks.
Find out more about how to run your entire 3PL from one platform here.
Q: Can I set up real-time warehouse reporting tools in CartonCloud?
A: CartonCloud makes it easy to create custom reports based on the data you want to track. For example, you can build a Bulk Charges Report in just a few clicks to see how long stock has been sitting in certain warehouse locations.
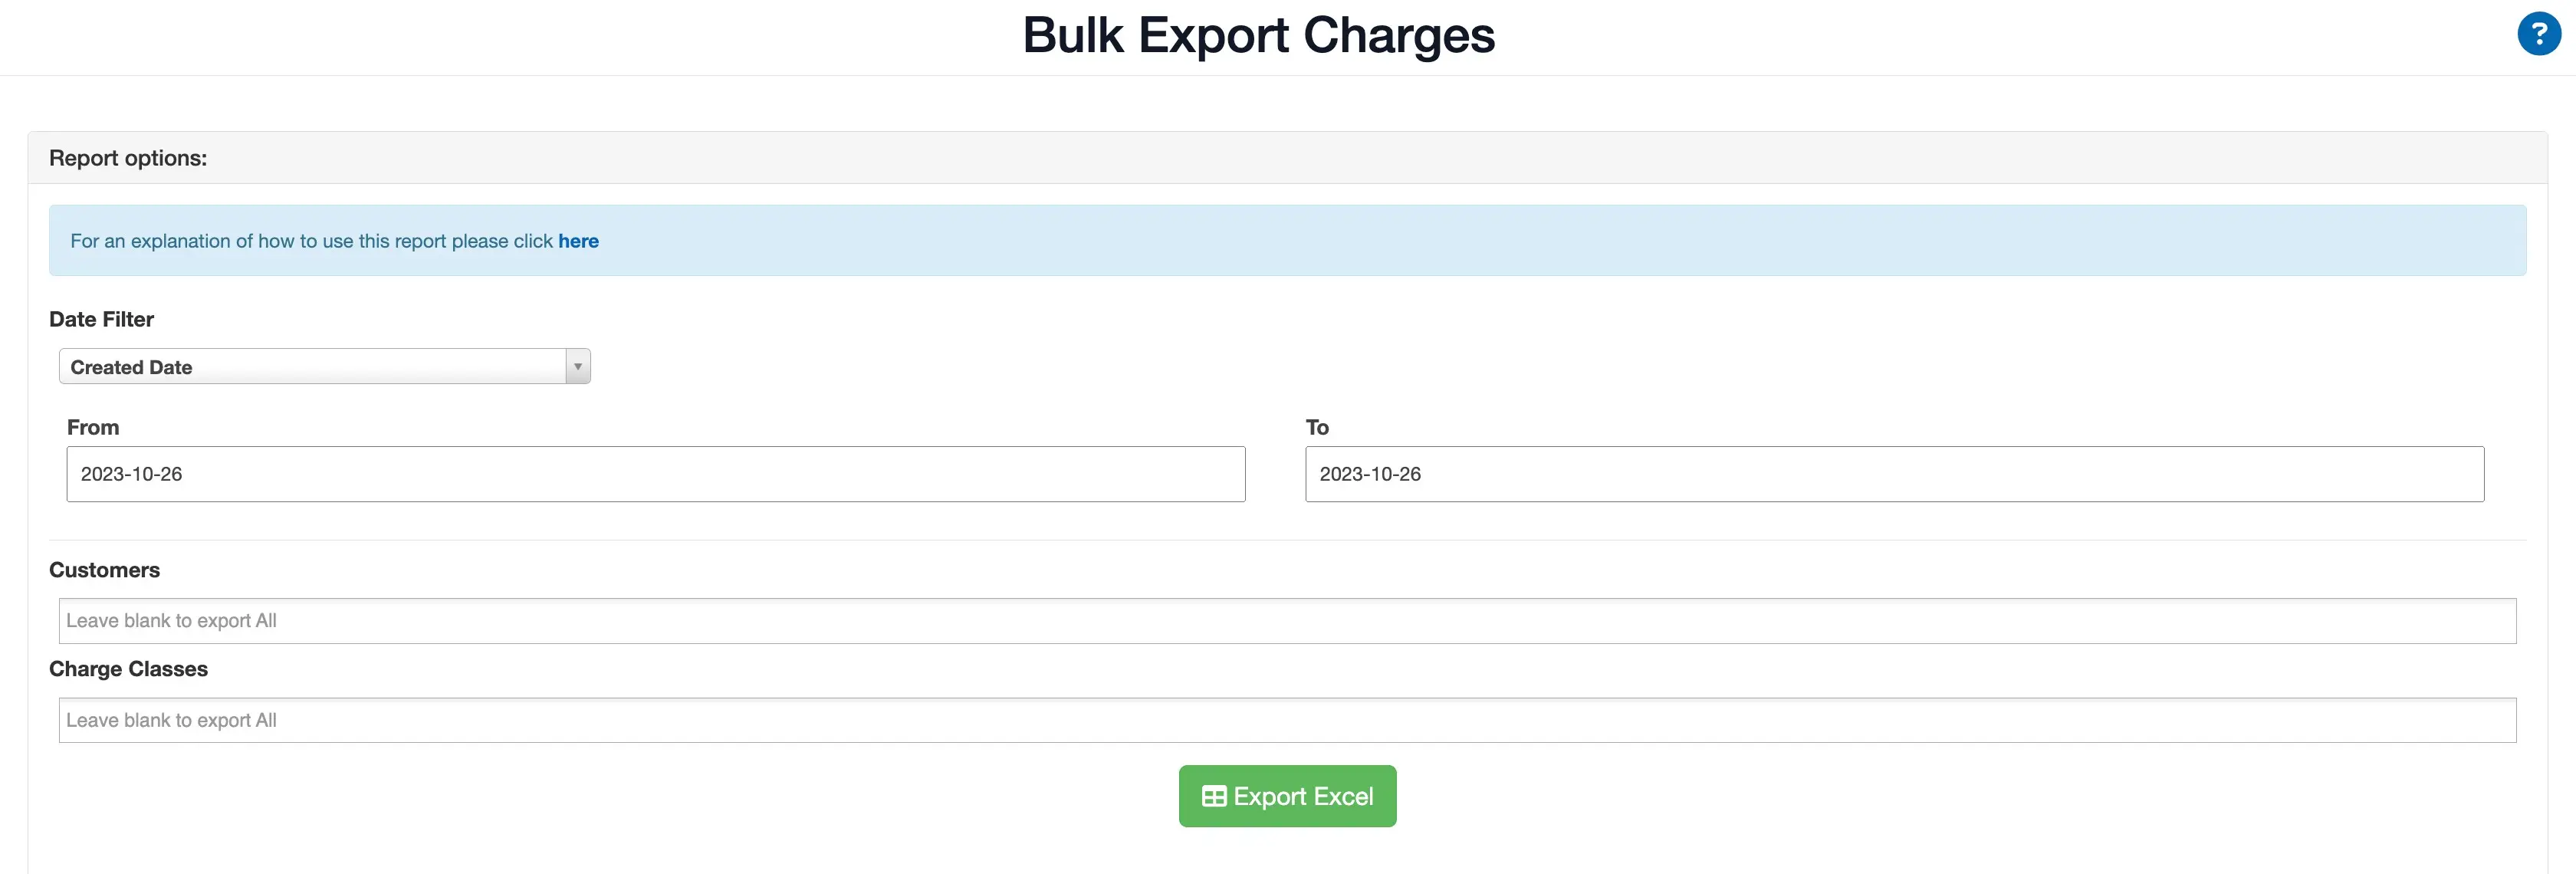
To create this report, simply:
- Choose your Date Filter (Created Date, Invoice Date, or Activity Date).
- Select your From/To date range.
- Pick the Customers you want included.
- Choose ‘Storage Periods’ to see how long stock has been sitting.
- Click Export Excel to generate your report!
This gives you instant visibility into how long inventory has been stored, helping you decide when to relocate, consolidate, or review your storage rates.
You can also take advantage of CartonCloud’s automatically generated Pallet Wrapped Report, which appears on your dashboard each year. It gives you a snapshot of your 3PL’s annual performance, including insights like your most commonly ordered product, helping you to plan for the next year and make any necessary changes to your warehouse space if required.
For example, if protein powder turns out to be your top-ordered product for the year, you might expand your temperature-controlled pick faces, assign it an A-mover slot closer to packing, or increase your replenishment frequency to keep up with demand in the following year.
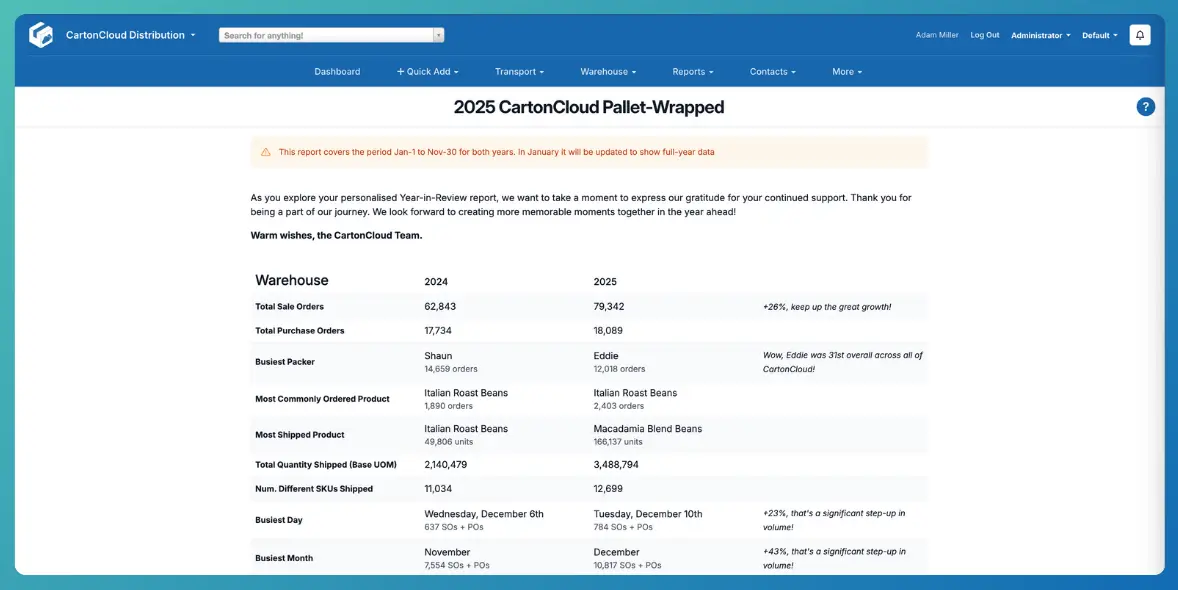
“The idea to see the Busiest Packer and Driver is awesome, this way we can acknowledge the legends. Keeping track and seeing the comparison over the years LOVE IT!!!!!!!!!!!!!!!!!!!!” — Linda du Preez, Kiwi Furniture Movers
“The wrap up has some wonderful stats. Comparing year to year for all items is fantastic knowledge to see which way the business is tracking.” — Ashley Roberts, InterCentral Logistics
For any assistance in creating your own warehouse inventory reports in CartonCloud, feel free to reach out to our support team for help!
Key Takeaways
- CartonCloud’s real-time warehouse reporting tools helps you use every inch of your warehouse with greater efficiency. By reviewing stock movements, storage duration, and location activity, you can quickly identify what stock is taking up unnecessary space and reorganize your warehouse layout based on actual demand.
- You can use 3PL stock reports to ensure your warehouse stock placements are fully optimized. Insights from real-time warehouse reporting tools like CartonCloud’s Stock Movement report and Bulk Charges report help you position fast movers up front, push slow movers further back, and optimize your pick faces for better flow and less congestion.
- Increased warehouse visibility with real-time warehouse reporting tools leads to better space planning — and better profitability. When you know how long stock sits, how much space each client uses, and where bottlenecks form, you can consolidate inventory, plan ahead, and ensure your warehouse layout matches your operational needs.
Want to know more?
To see CartonCloud’s real-time warehouse reporting tools in action, book a free demo with our team today!
Explore the resource hub
Tips, tools, downloadable guides and stories from logistics teams who are working smarter.


.webp)